How COVID-19 has Impacted the U.S. Financial Markets and the Role of the Fed
Insights SRD/New York Research CenterSince the start of the financial turmoil caused by the COVID-19 outbreak, the Fed has done everything within its power to support the U.S. economy, and the effects are beginning to show - easing liquidity pressures and calming financial market turmoil.
Treasury Market
In late February, Treasuries became the safe-haven assets for investors. Increased money flow into the Treasury market led to higher prices and yields reaching a record low of nearly 0.5%. At that time, government bonds also experienced an unusually vicious cycle of fire sales/prices falling, with a slight increase in interest rates and a sharp rise in volatility The 10-year Bond Volatility Index hit an all-time high of 16.39 on March 19, well above its 2008 peak of 14.47. This forced the Fed to intervene and take the following actions.
- QE4 Unlimited: The Treasuries in the Fed's assets rose from $2.4 trillion on March 23 to $3.3 trillion in early April, reaching an all-time high. Mortgage-backed securities, on the other hand, also reached an all-time high rising from $0.4 trillion to $0.58 trillion.
- Primary Dealer Credit Facility (PDCF): This facility will allow primary dealers to support smooth market functioning and facilitate the availability of credit to businesses and households.
Since March 23, liquidity in Treasuries has improved significantly. Although the 10-year Bond Volatility Index fell sharply, it returned to normal levels in early April (see Figure 1).
Figure1: CBOE 10-Year Treasury Note Volatility Futures (%)
(Source: CBOE)
Commercial Paper Market
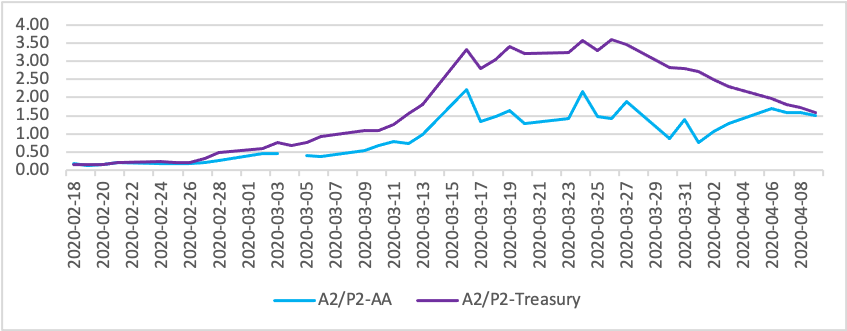
Corporate funding constraints and a freeze in the CP market led to a significant increase in the cost of commercial borrowing. The A2/P2 market first issued a warning at the end of February, and its spread with AA-grade and Treasury widened as early as the end of February and continued to rise in March.
The Fed implemented the following policy tools, some of which were used in the 2008 crisis to ease market volatility:
- Commercial Paper Funding Facility (CPFF):The SPV of the Fed will purchase from eligible issuers three-month CPs through primary dealers. U.S. issuers of commercial paper, including municipal issuers and U.S. issuers with a foreign parent company, are eligible here.
- Money Market Mutual Fund Liquidity Facility (MMLF): The Fed makes loans available to eligible financial institutions secured by high-quality assets purchased by the financial institution from MMMF. MMLF will assist MMMFs in meeting redemption demands by households and other investors, hence enhancing overall market functioning and credit provision to the broader economy.
The Fed's actions have prevented the market from continuous decline, with the market stabilizing since late March. Spreads are on a downward trend – A2/P2 and Treasury spreads fell from 3.6% to 1.58%; and the AA-rated spreads fluctuated largely but also showed a downward trend from 2.2% to 1.5% or so (see Figure 2)
Figure 2: A2/P2-AA,A2/P2-Treasury Spread (%)
(Source: Fed)
Corporate Bonds and Loan Market
The Fed's rescue efforts covered almost all businesses and industries given the severity and pervasiveness of the financial issues. The Fed implemented a new policy tool through the Treasury-backed SPV, providing direct credit support to businesses and households as lender as a last resort:
- Primary Market Corporate Credit Facility (PMCCF): Companies will have access to credit to better maintain business operations and capacity during periods of dislocations related to the pandemic. This facility is open to investment-grade companies and can provide bridge financing for up to four years.
- Secondary Market Corporate Credit Facility (SMCCF): Purchase secondary market corporate bonds issued by investment-grade U.S. companies and U.S.-listed exchange-traded funds, which can help provide broad exposure to the market for U.S. investment-grade corporate bonds.
- Term Asset-Backed Securities Loan Facility (TALF): This will enable the issuance of asset-backed securities (ABS) backed by student loans, auto loans, credit card loans, loans guaranteed by the SBA, and certain other assets.
- Paycheck Protection Program Liquidity Facility (PPPLF):This will bolster the effectiveness of the Small Business Administration’s (SBA) Paycheck Protection Program (PPP),supplying liquidity to participating financial institutions through term financing backed by PPP loans to small businesses.
- Main Street Lending Program: Enhances support for small and mid-sized businesses that were in good financial standing before the crisis, offering 4-year loans to companies employing up to 10,000 workers or with revenues of less than $2.5 billion.
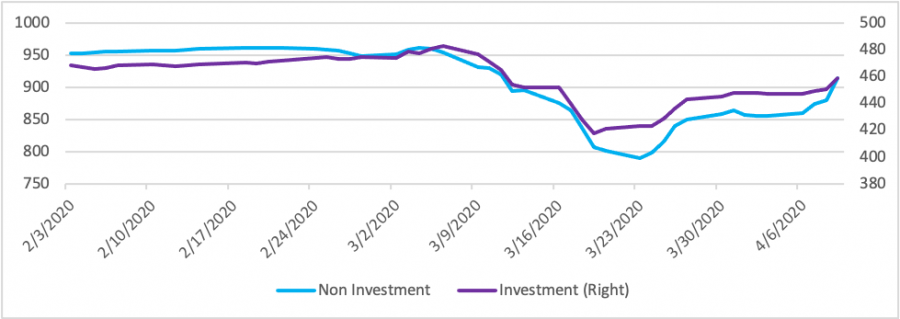
The effects of the Fed's unprecedented involvement have been demonstrated, with the following changes in the corporate debt market since March 20:
- The vicious circle of fire sales ended, and the market resumed a more normal bidding process.
- The price index of investment-grade and non-investment-grade bonds of the S&P 500 rebounded (see Figure 3).
Figure 3: S&P 500 Investment and Non-investment Bonds Index
(Source:S&P)
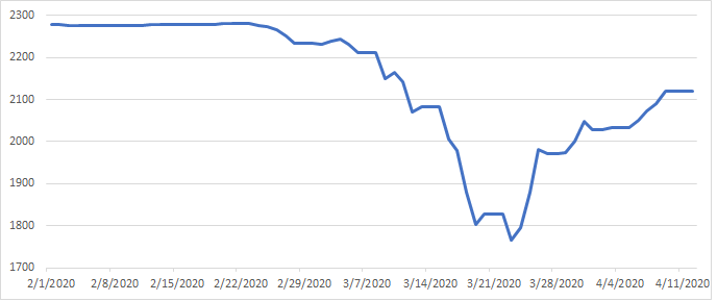
U.S. Leveraged Loan Index Rebound (see Figure 4).
Figure 4: S&P/LSTA U.S. Leveraged Loan 100 Index
(Source:S&P)
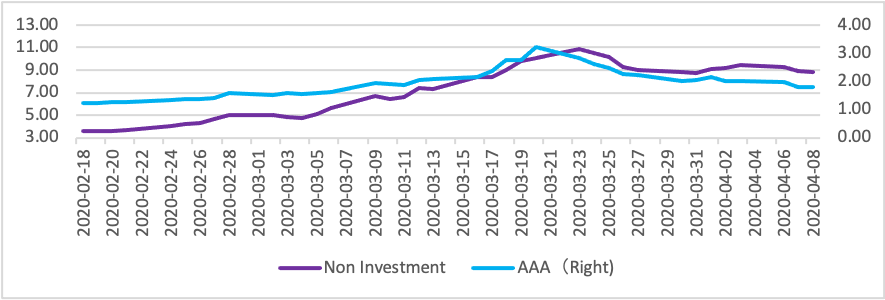
Investment and non-investment-grade bonds and Treasury spreads fall (see Figure 5).
Figure 5: Spreads between U.S. 10-year AAA, Non-investment- Corp. Bonds and Treasury Bonds (%)
(Source:Fed)
The Risk State and Future Development of the Financial Crisis in the U.S.
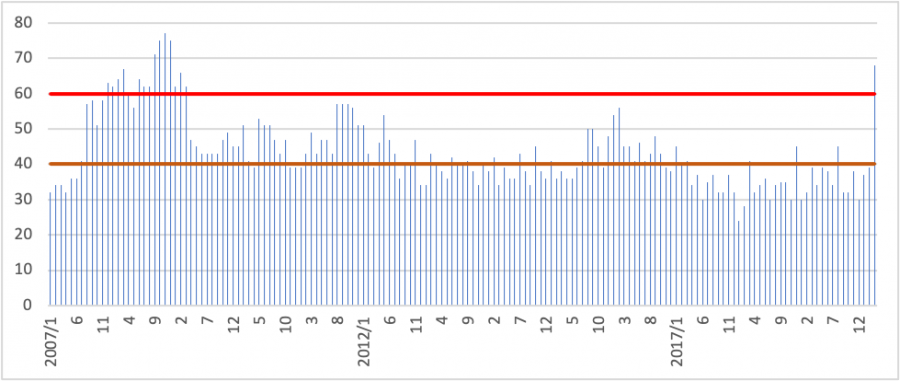
In late March, financial market risk surged, resulting in the monthly Risk Indicators of Financial Crisis (RIOFC) rising from 39 in February to 68 in March, entering what is known as the dangerous zone (see Figure 6). This was the first time the RIOFC entered a dangerous zone since April 2009, reaching a level close to that before the 2008 crisis. As many as 10 areas where risk indicators have deteriorated and entered the dangerous zone. This indicator signals a heightened risk of a full-blown financial crisis in the U.S.
(Figure 6) Risk Indicators of Financial Crisis, RIOFC (Month, 2007/1-2020/3)
(Source:Bank of China, New York Branch)
The Fed's policies and financial stability measures have largely eased the liquidity crisis, providing adequate support to financial markets and institutions to maintain normal functioning amid ongoing volatility. Given the severity of the shock, however, the risk of default-based debt crisis remains high. This trend is likely to spread not only from businesses to households, but also to commercial and residential real estate sectors.
Disclaimer
Bank of China USA does not provide legal, tax, or accounting advice. This article is for information and illustrative purpose only. It is not, and should not be regarded as “investment advice” or as a “recommendation” regarding a course of action, including without limitation as those terms are used in any applicable law or regulation. Bank of China USA does not express any opinion whatsoever as to any strategies, products or any other information presented in this article. This article is subject to change without notice. You should consult your advisors with respect to these areas and the article presented herein. You may not rely on the article contained herein. Bank of China USA shall not have any liability for any damages of any kind whatsoever relating to this article. No part of this article may be reproduced in any manner, in whole or in part, without written permission of Bank of China USA.


